Ever since Keynesian economics fell out of favour in the wake of the stagflation that hit Western economies in the 1970s, the prevailing view among most policy makers in advanced economies has been that so-called free markets do a better job of driving economic activity than governments.
And though this standpoint has been tempered somewhat by the financial meltdown of 2008 and the ensuing massive economic downturn, the common perception that the public sector rhymes with inefficiency continues to hold sway.
Public debt is often the excuse employed to justify reducing the size of government – downturn or no downturn. In the wake of the crisis, for example, laissez-faire advocates backed austerity measures aimed at making government smaller for fear of the consequences of rising indebtedness.
Now that economic growth has returned, the argument is different, but the potential threat brandished – public debt – remains the same. The OECD’s 2017 Economic Survey of France, for instance, put it to France that it needed to cut back government to ensure debt sustainability and lift a drag on economic growth.
Indeed, the debate regarding the public sector is highly topical in France – and, unsurprisingly, extremely delicate – with President Emmanuel Macron having campaigned on the promise to reduce the ranks of government employees.
A timely comparison
Given this, and given the fact that France is often the subject of much finger-wagging in English-language media for its allegedly bloated government, now is a good time to take a close look at France’s public sector and compare it to those in other advanced economies.
With this in mind, France Stratégie economists Flore Deschard and Marie-Françoise Le Guilly combed through OECD and Eurostat statistics from 19 advanced economies, comparing all aspects of the countries’ public sectors.[1]
The result, the Public Employment Dashboard (Tableau de bord de l’emploi public), illustrates France has in effect made a significant choice to “socialize risk”, i.e. create a social safety net.
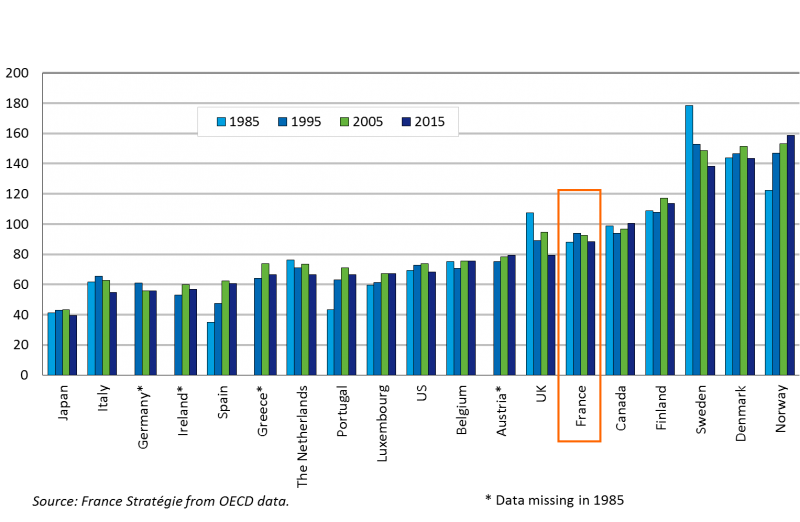
One of the most common ways of measuring the share of public employment in an economy is to calculate the percentage of government employees in the overall population. Without a doubt, France is among the countries with a high ratio in this regard. In 2015, it had 89 functionaries per 1 000 inhabitants, compared to 80 for the UK, 75 for Belgium and 68 for the US (see Graph 1). The authors stress, however, this rate is well below that seen in Scandinavian countries – Sweden, Denmark and Norway all have around 140 public sector employees per 1 000 inhabitants.
Graph 1 – Number of public sector employees per 1 000 inhabitants, 1985-2015

Beyond public payroll
Though looking at the number of government employees provides a snapshot of the size of the public sector in an economy, the authors point out it can lead to misconstruing comparisons between countries. This is because some countries outsource government jobs to the private sector, but in the end they are still paid from the public purse.
Deschard and Le Guilly illustrate this with Germany. Its healthcare system is similar in scope to France’s, but on the surface it has a lot less public sector jobs in the health industry. This is because the German government typically staffs its hospitals by way of private contracts with healthcare providers. Once these jobs are taken into account, the gap with France narrows.
Aside the number of public sector employees, the other indicator for determining the extent of the public sector is the volume of public spending. There is no doubt France’s public spending at 57% of GDP in 2015 is exceptional: it is higher than every country except Finland.
However, when operational spending is taken into account, the image that emerges is more nuanced. For example, France spent considerably less in 2015 on transfers in kind of services such as medical reimbursements and housing aid than other countries: this accounted for 6% of its GDP compared to 8% for Germany and Belgium and 9% for Japan.
What’s more, over the past 10 years the French government has not necessarily increased its outsourcing to private contractors. It subcontracted 28% of government spending in 2015, whereas the figure for the UK was 48% , 38% for Germany and around 40% for Sweden and the Netherlands.
Teasing out the complexities
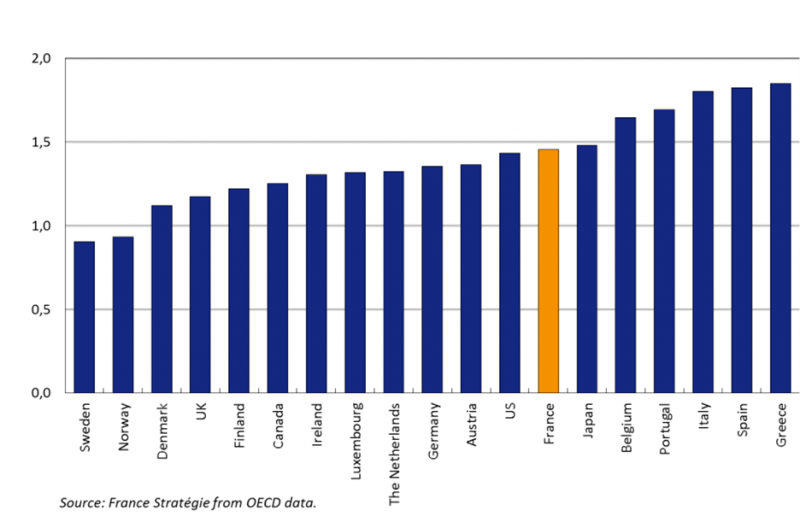
The amount France spends on public payroll can also be somewhat misleading. At 13% of the country’s GDP in 2015, it is more than five percentage points higher than Germany and surpassed only by Finland, Norway and Denmark. However, when the figure is compared to GDP per capita, it is relatively moderate compared when compared to other advanced economies (see Graph 2).
Graph 2 – Ratio of public sector payroll to GDP per capita, in 2015

The authors also look at spending on education, which they underline consumes the lion’s share of public expenditures in most countries. In 2015, France spent around 5.5% of its GDP, compared to under 5% for Germany, just over 5% for Japan, around 6% for the UK and the US, and around 7% for Finland and Sweden.
If anything, the Dashboard shows that gauging the size of government and comparing different countries’ public sectors is a dicey affair that can’t be reduced to any one single figure, as is often the case. And in the context of refashioning government in the 21st century, as Deschard and Le Guilly contend, “the reforms that take [the] complexities into account may end up being more credible and more reachable.”
[1] The countries included Germany, Austria, Belgium, Canada, Denmark, Spain, the US, Finland, France, Greece, Ireland, Italy, Japan, Luxembourg, Norway, the Netherlands, Portugal, the UK and Sweden.


